DBSCAN is popular clustering algorithm with the following advantages:
- Unlike k-means we don’t have to specify the number of clusters.
- Can automatically detect the outliers
- Works well with noisy datasets
- Works well with clusters of any shape unlike k-means which works well for spherical clusters
However DBSCAN algorithms works best when we optimize two of its parameters epsilon(ε) and ‘MinPts’. In this post we will see how the algorithm improves performance when the two parameters are optimized and also we will see how to optimize these two parameters.
What are these parameters(‘ε’ and ‘MinPts’)
Minimum Samples (“MinPts”): The fewest number of points required to form a cluster
Though there is no specific formula to determine the values of these two parameters, couple of rules of thumb could come in handy.
- ‘MinPts’ should be greater than or equal to the dimensionality of the data set
- DBSCAN’s default value for MinPts is 4. For 2-dimensional data(Data with 2 feature columns) this default value should be used
- For Data with more than 2 features(Multi dimensional data), MinPts=2 x No. of features(Sander et al., 1998)
- For noisy data a bigger value should be chosen.
Epsilon (ε): The maximum distance two points can be from one another while still belonging to the same cluster
Once the ‘MinPts’ is selected, the epsilon value could be chosen by one technique mentioned in the paper.
- select k=Min Pts(Calculated above)
- Check average distance of each point with its k-neighbours
- Plot the above average distance in ascending order.
- The optimum value of ‘ε’ is taken from this k-distance graph, where there is maximum curvature.
Hands on
- Create a dummy dataset
- Apply K-means clustering
- Apply DBSCAN without optimized parameters
- Apply DBSCAN with optimized parameters
Spin up the Jupyter Notebook
Lets create a toy dataset using sklearn’s make_blobs library to clearly show the difference between
K-means and DBSCAN.
import numpy as np
import matplotlib.pyplot as plt
from sklearn.datasets import make_blobs
from sklearn.cluster import KMeans
# generate some random cluster data
X, y = make_blobs(random_state=170, n_samples=600, centers = 5)
rng = np.random.RandomState(74)
# transform the data to be stretched
transformation = rng.normal(size=(2, 2))
X = np.dot(X, transformation)
# plot
plt.scatter(X[:, 0], X[:, 1])
plt.xlabel("Feature 0")
plt.ylabel("Feature 1")
plt.show()
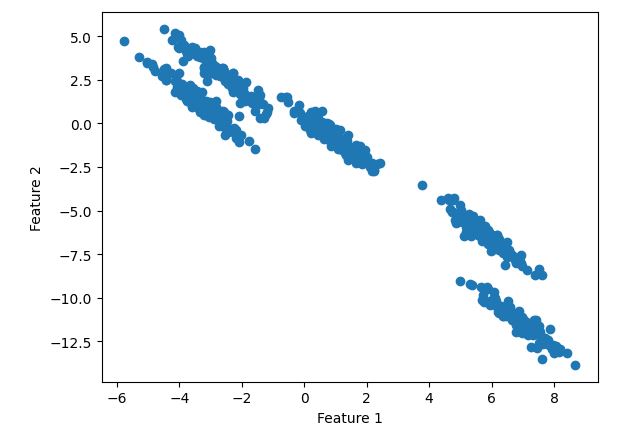
Toy dataset.It has 2 features ‘Feature 1’ and ‘Feature 2’
K-means
We will put k=5
# cluster the data into five clusters
kmeans = KMeans(n_clusters=5)
kmeans.fit(X)
y_pred = kmeans.predict(X)
# plot the cluster assignments and cluster centers
plt.scatter(X[:, 0], X[:, 1], c=y_pred, cmap="plasma")
plt.scatter(kmeans.cluster_centers_[:, 0],
            kmeans.cluster_centers_[:, 1],
            marker='^',
            c=[0, 1, 2, 3, 4],
            s=100,
            linewidth=2,
            cmap="plasma")
plt.xlabel("Feature 1")
plt.ylabel("Feature 2")
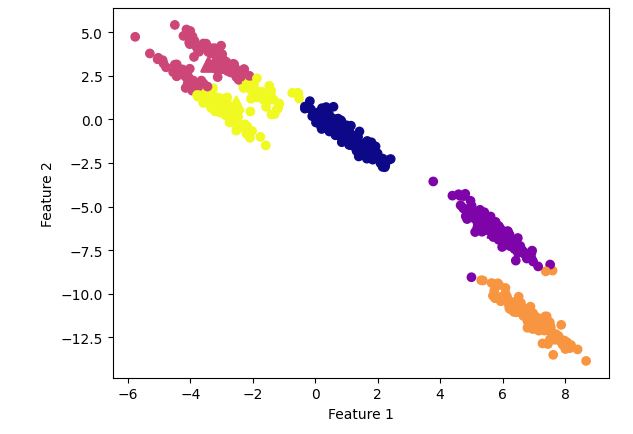
K-means clustering
Observation:
It is clearly visible that k-means was unable to create distinct clusters.
Let’s see what happens with DBSCAN clustering algorithm.
DBSCAN
Without parameter optimization
from sklearn.preprocessing import StandardScaler
scaler = StandardScaler()
X_scaled = scaler.fit_transform(X)


dbscan = DBSCAN()##Default parameters
clusters = dbscan.fit_predict(X_scaled)
# plot the cluster assignments
plt.scatter(X[:, 0], X[:, 1], c=clusters, cmap="plasma")
plt.xlabel("Feature 1")
plt.ylabel("Feature 2")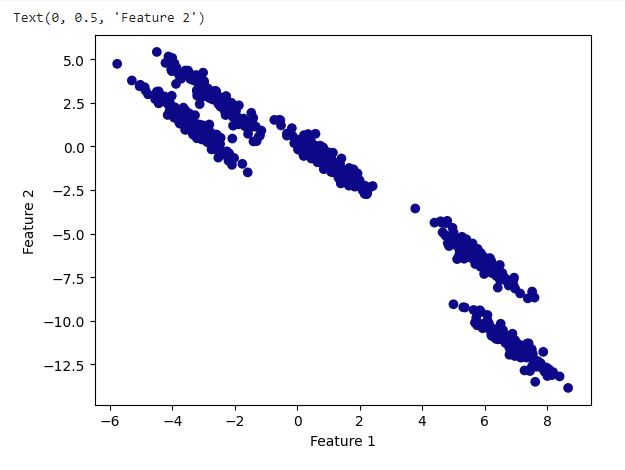
DBSCAN with default parameter
Observation:
With the default parameters DBSCAN performed worse as is evident from the above plot. It ended up forming one cluster
DBSCAN with parameter optimization
Let’s fine tune the value of ‘ε‘ and ‘Min Pts’ and check. As explained above lets plot the K-distant graph.
As our data has 2 features , we will choose ‘MinPts”=4(Default value as explained above)
To plot k-distance graph, choose k=MinPts=4(explained above)
##Plotting k-distance graph
neighbors = NearestNeighbors(n_neighbors=4)
neighbors_fit = neighbors.fit(X_scaled)
distances, indices = neighbors_fit.kneighbors(X_scaled)

distances = np.sort(distances, axis=0)
distances = distances[:,1]
plt.plot(distances)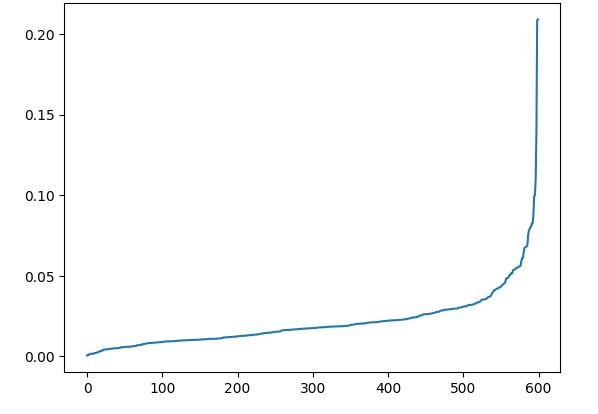
K-distance graph
Observation:
As can be seen from the K-distance ,maximum curvature occurs somewhere around 0.03. To optimally select the value of ‘ε‘ we will utilize silhouette_score.
We will take different combination of minimum samples and epsilon and do the clustering with DBSCAN and evaluate the clustering with silhouette_score.We will choose the values which produces the highest silhouette_score.
min_samples = range(2,5)
### We will check with minimum samples from 2 to 5
eps = np.arange(0.03,0.1, 0.01) # returns array of ranging from 0.05 to 0.1 with #step of 0.01

from sklearn.metrics import silhouette_score
from collections import Counter


output = []

for ms in min_samples:
    for ep in eps:
        labels = DBSCAN(min_samples=ms, eps = ep).fit(X_scaled).labels_
        score = silhouette_score(X_scaled, labels)
        output.append((ms, ep, score))

min_samples, eps, score = sorted(output, key=lambda x:x[-1])[-1]
print(f"Best silhouette_score: {score}")
print(f"min_samples: {min_samples}")
print(f"eps: {eps}")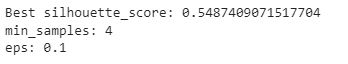
Now after doing the iterations we are getting ‘ε‘=0.1.
Let’s use these values and do the clustering.
# cluster the data into five clusters
dbscan = DBSCAN(eps=.1, min_samples = 4)## values obtained from iterations
clusters = dbscan.fit_predict(X_scaled)
# plot the cluster assignments
plt.scatter(X[:, 0], X[:, 1], c=clusters, cmap="plasma")
plt.xlabel("Feature 1")
plt.ylabel("Feature 2")
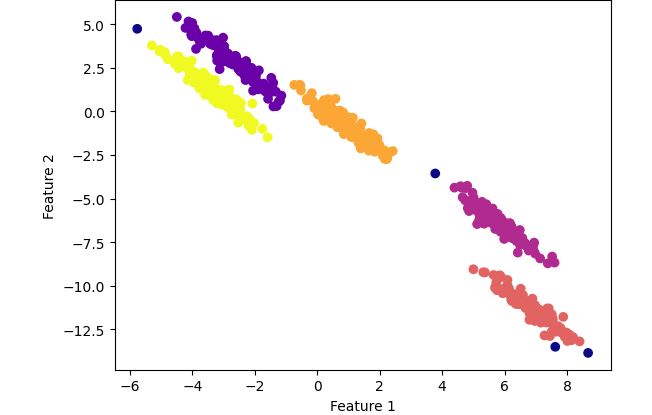
DBSCAN clustering with optimized parameters
Observation:
Now the clustering looks perfect ! It has grouped the data points into 5 distinct clusters unlike K-means where the clusters were overlapped.
Conclusion:
Choosing the optimum parameter values of DBSCAN algorithm can outperform K-means clustering algorithm.
(Complete code can be found below:
https://github.com/soumyasrs86/Machine-Learning/blob/main/Unsupervised/K_means_Vs_DBSCAN.ipynb)
0 Comments